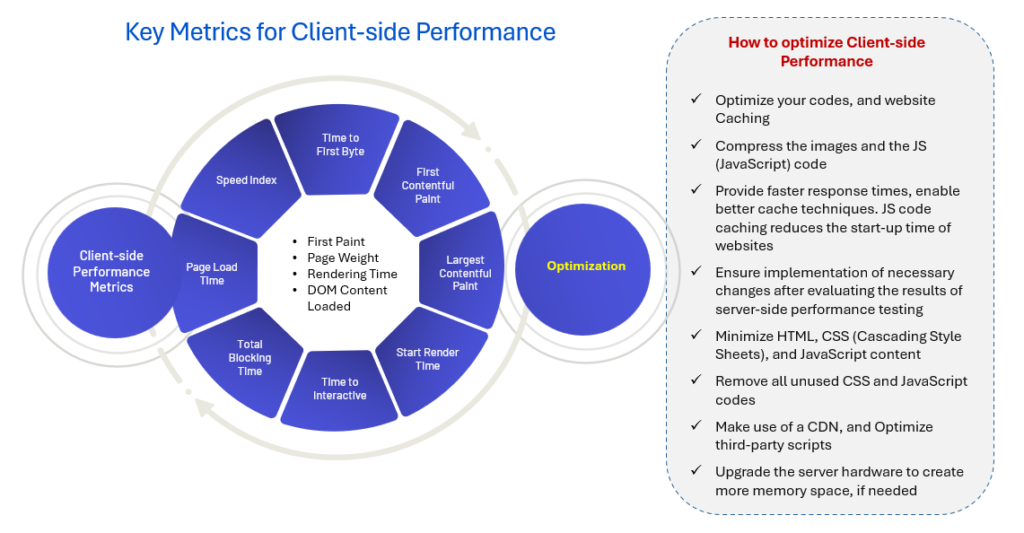
Most of market-leading performance testing tools (LoadRunner, JMeter, NeoLoad etc.) provide server response time when performing different types of tests such as Load, Stress, Spike, and Endurance. However, it is also essential for Performance testers to capture the Client-side performance metrics while performing load testing. In this post, we will discuss what are key metrics to be measured for client-side performance and how to optimize client-side performance.
Web applications are developed with a combination of server-side and client-side code. Web applications may have performance problems on either side, and both need to be optimized.
Client-side: The client-side performance can be seen within the web browser itself. This includes initial page load time, downloading all the resources, JavaScript that runs in the browser, and more.
Server side: The server side relates to how long it takes to run on the server to execute requests. Optimizing the performance on the server generally revolves around optimizing things like database queries and other application dependencies.

Client-side Performance Metrics
Some of the key metrics can be measured as below:
- Page Load Time – It indicates when the page was completely loaded and accessible on a user’s browser.
- Page Weight /Total requests – It measures the size of the resources being downloaded when loading the page like images, Java script file etc.
- Speed Index – Measures how quickly most of the page content is rendered. Unlike Largest Contentful Paint it does not focus on a single UI element being rendered but looks at the whole screen.
- Time to First Byte – Measures how quickly the server responds to the HTML document request. It includes time spent establishing a server connection or on redirects.
- First Paint – It measures the time how quickly the browser to render any pixel on the screen after a user navigates to a web page.
- First Contentful Paint – It measures the time how quickly the browser to first render any content from the DOM (images, texts, SVG, or non-white canvas) to the page.
- First Meaningful Paint – It is a browser-supplied metric that measures how long it takes for the most meaningful content to be fully rendered on the site. It is equivalent to FIRST-CONTENTFUL-PAINT and describes the duration until the browser first rendered any text, image (including background images), non-white canvas or SVG.
- Largest Contentful Paint – Measures how quickly the largest page element appears. This could be a hero image or a big heading.
- Time to Interactive – How long it takes for a web page to become fully interactive.
- Start Render Time – The metric that refers to the time it takes for a web app to load enough that the user can interact with the page. Specifically, Start Render Time is the time it takes for the DOM to complete and the window to load the event.
- Total Blocking Time – How much time is blocked by scripts during page loading process.
- DOM Content Loaded – This is the time at which the DOM is ready and there are no stylesheets blocking JavaScript execution.
How to optimize Client-side performance
- Optimize your codes, and website Caching.
- Compress the images and the JS (JavaScript) code.
- Provide faster response times, enable better cache techniques. JS code caching reduces the start-up time of websites.
- Ensure implementation of necessary changes after evaluating the results of server-side performance testing.
- Minimize HTML, CSS (Cascading Style Sheets), and JavaScript content.
- Remove all unused CSS and JavaScript codes.
- Make use of a CDN and Optimize third-party scripts.
- Upgrade the server hardware to create more memory space, if needed.

