Client-side Performance using Jmeter + Selenium WebDriver
It is important to find out the overall page load time during load testing because even though server response might be good, there could be an issue with certain UI elements. For an example, an image could take additional time to load, in such a scenario the need to compress image size is ideally not a server-side issue. Faster results can only be achieved by integrating JMeter with Selenium using Selenium WebDriver plugin.
How to Configure Selenium WebDriver with JMeter
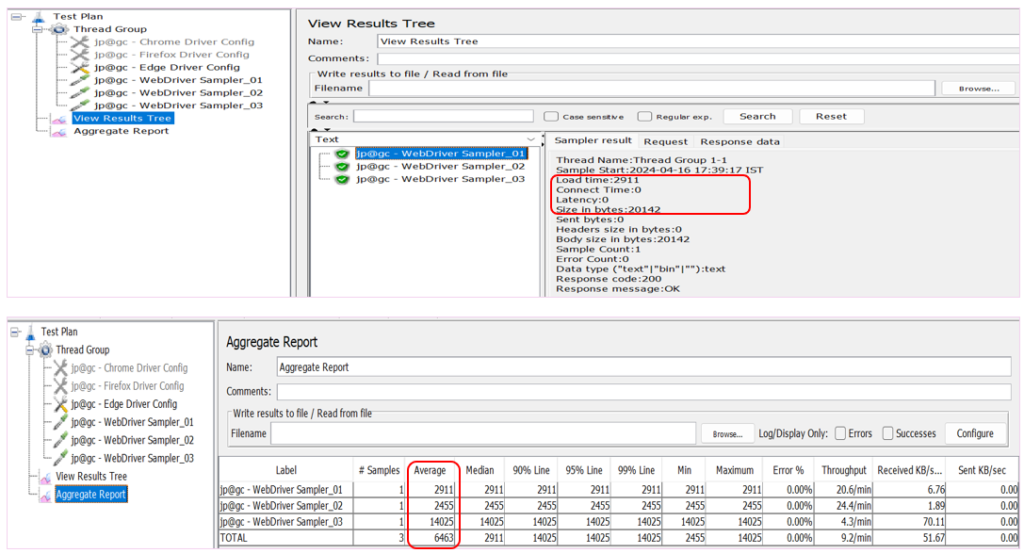
Step 1: launch Jmeter and add Plugin, Selenium/WebDriver Support
Step 2: Create a Test Plan and add Thread Group
Step 3: Add Config Element -> jp@gc – Edge Driver Config / jp@gc – Chrome Driver Config
Add Sampler -> jp@gc – WebDriver Sampler
Add Listener -> View Result Tree
Add Listener -> Aggregate Report
Step 4: Download msedgedriver.exe for Edge browser, chromedriver.exe for Chrome browser
Step 5: Add Scripts in WebDriver Sampler
Step 6: Replay Script and Validate it
Note: Each Thread in WebDriver Sampler will open separate Browser instance and each Browser consumes significant amount of resources. So, Headless option can be used to Run Jmeter scripts to avoid high consumption of resources.

Chrome, Firefox, Edge or any other browsers can be used by downloading the Driver of that browsers. To run the script, make sure browser is closed else script will be failed.

